Sunday, May 31, 2009

China Production Continues to Expand

WSJ reports:

The CLSA China Purchasing Managers Index, a gauge of nationwide manufacturing activity, rose to 51.2 in May from 50.1 in April, CLSA Asia-Pacific Markets said Monday.

May was the second consecutive month the CLSA PMI was above 50.0, after eight months of it being below the key level. A PMI reading above 50.0 indicates the manufacturing economy is expanding, while a reading below 50 indicates contraction.

"For the first time the PMI shows genuine evidence that policy really is gaining traction. While the export orders index remained just below the 50 neutral threshold, total orders jumped to the highest level for 10 months," said CLSA's head of economic research, Eric Fishwick.

"The rate of destocking increased in May, encouraging in light of some anecdotal suggestions that production is running ahead of orders. In aggregate the reverse is true, pointing to sustained output growth in months to come," he added.


While I am not an expert to fully grasp whether China is baking the numbers, the tracking error between these PMI figures and electricity numbers are curious. Add to that this tidbit from the WSJ (hat tip Paul Krugman) and I think we should all be at least cautious of the Chinese rebound story.
The focus these days is on the mismatch between China’s electricity consumption and a key measure of industrial output.

For most of the past decade, China’s industrial value-added growth (IVA) –industry output less input costs – has moved broadly in step with movements in electricity consumption. But the relationship’s broken down recently: electricity use is still seeing negative growth, while IVA is growing at a decent positive rate again.

Some China analysts are crying foul: If IVA growth figures are being cooked, surely that means China’s recent GDP data have been overstated too. China’s statisticians use IVA output to estimate what accounts for nearly half of China’s GDP.

China’s association of electricity generators has a solution: it’s stopped publishing consumption data.

Friday, May 29, 2009

Movie Bonanza Historical Context

As we've detailed a few times prior, 2009 is on pace to be one of the best years of the past 30 years (all the data I have) in both nominal and real terms.

Top Grossing Movie - Year - Actual $$ - 2009 $$


I'm still trying to grasp how Three Men and a Baby was the #1 grossing film of 1987...

Source: Box Office Mojo

Yesterday's News: Durable Goods

Traveling again today, so no GDP analysis by EconomPic this morning (tear). Instead yesterday's Durable Goods details.

Bloomberg details:

Durable-goods orders hovered near a 13-year low and the number of Americans collecting unemployment insurance reached a 17th straight record, offering no sign of an imminent rebound from the worst U.S. recession in half a century.

Orders rose 1.9 percent in April after a 2.1 percent drop in March that was more than twice as large as previously estimated, the Commerce Department said in Washington. Meanwhile, the Labor Department said 6.79 million people are collecting jobless benefits, and another report showed new-home sales were lower than forecast in April.
Looking the new orders YTD through April vs. the same time period in 2008, the ONLY area that has grown... defense.


Obvious guy says:
“We have a tough slog ahead of us,” said Carl Riccadonna, a senior U.S. economist at Deutsche Bank Securities Inc. in New York. “The recovery is going to be very slow in its emergence.”
Source: Census

Japanese Industrial Production's Upside Surprise

FT's Alphaville:

The FT reports that Japan’s industrial output bounced back 5.2 per cent in April compared with the previous month, a stronger rise than analysts expected and a boost to hopes. What’s more, with government stimulus spending starting to support demand and manufacturers starting to reverse the drastic cuts to production imposed by a collapse of demand since late last year, the Ministry of Economy, Trade and Industry said surveyed manufacturers expected their output to rise a further 8.8 percent in May and 2.7 percent in June.
Good news? Absolutely. But keep this in perspective. Even with that jump, Industrial Production in Japan is down 31% from April of 2008.


Source: Meti.Go

Thursday, May 28, 2009

Maybe They Should Try "Buy One Get One Free"?

I was traveling today / am traveling tomorrow, thus the delay / light posting.

Barry from the The Big Picture details the latest new homes sales datapoint (i.e. IGNORE the media):

Another month, another disastrous housing data point:

Sales of new one-family houses in April 2009 were at a seasonally adjusted annual rate of 352,000, according to estimates released jointly today by the U.S. Census Bureau and the Department of Housing and Urban Development. This is 0.3 percent (±14.5%)* above the revised March rate of 351,000, but is 34.0 percent (±11.0%) below the April 2008 estimate of 533,000.

The median sales price of new houses sold in April 2009 was $209,700; the average sales price was $254,000. Median prices of a new home decreased 14.9%

The seasonally adjusted estimate of new houses for sale at the end of April was 297,000. This represents a supply of 10.1 months at the current sales rate.

Also very telling that the homes that are selling appear to have been massively discounted (i.e. new homes priced under $150k have actually held up pretty well).

New Houses Sold by Sales Price


Source: Census

Just a Rebound?

We've seen similar charts in the past, but the outperformance of high yield (especially compared to Treasuries) has been astounding.


How astounding? Well, what had been an unprecedented sell-off is now an unprecedented rebound.

If Only the Treasury were a Bank

First lets rewind to see one of the ways Citi was able to turn a profit in its most recent quarter (per Calculated Risk):

Citigroup posted a $2.5 billion gain because of an accounting change adopted in 2007. Under the rule, companies are allowed to record any declines in the market value of their own debt as an unrealized gain.
Now lets take just one segment of the HUGE new U.S. Treasury issuance, the long bond (i.e. 30 year Treasury). According to data from Treasury Direct, the Treasury has had four 30 year auctions since last Fall.

30 Year Auctions


As a refresher, the price of a bond is inversely related to the interest rate (when interest rates go down, the coupons are discounted at a lower rate resulting in the higher price). The chart below details this phenomenon for the 30 year long bond for various interest rates. When the market rate (i.e. yield) is equal to the interest rate of the bond, the price of the long bond is PAR (i.e $100).

Price of a Long Bond at Various Interest Rates and Market Rates


The relevance? With 30 year rates spiking above 4.6% these bonds have lost a TON of market value. How much? Over 30% from their peak, but as much as 18% since February's auction.

Change in Long Bond Prices Since Issuance


That means February's $14 billion auction alone has already netted the government a cool $2.5 billion. Throw in the mass amounts the U.S. has made issuing 10 year bonds as low as 2.2% (now yielding 3.7%), thus making 15%+ profit as well, then according to "Citigroup accounting" we should be out of debt in no time...

The interesting takeaway of all of this... the U.S. doesn't need actual inflation to decay the value of the national debt.

Housing Bottom... Are the Hardest Hit There Yet?

In response to my post on the relationship between price and quantity of existing home sales, Sami commented:

ListingSupply.com has been showing that the supply of homes for sale nationwide has been dropping for several months now. I think home prices in the hardest hit areas like AZ, CA, and FL are pretty near the bottom.
In taking California as an example, I am not as sure. While the price has indeed fallen dramatically in both nominal and real terms, we see that is has still not corrected all the way in real terms. While I am not suggesting that home prices will fall another 40% in nominal terms, I wouldn't count it out over the next 5 or so years in real terms.


Though I will say that the second derivative has definitely, turned positive.

Source: S&P / BLS

Wednesday, May 27, 2009

Existing Homes Sales

AP reports:

A real estate group says sales of previously occupied homes rose modestly from March to April as buyers swooped in to take advantage of prices that were 15.4 percent below year-ago levels.

The National Association of Realtors said Wednesday that home sales rose 2.9 percent to an annual rate of 4.68 million last month, from a downwardly revised pace of 4.55 million in March.

The results slightly beat economists' forecasts. Sales had been expected to rise to an annual pace of 4.66 million units, according to Thomson Reuters.

The median sales price plunged to $172,000, down from $201,300 in the same month last year. That was the second-largest drop on record after January, when prices fell 17.5 percent.
Looking at the year over year change in price and quantity for the four regions below we see how a homeowner can sell their home more quickly... reduce the price!


Source: Realtor.org

Australia's Frozen Job Market

While Australia's economy has done relatively well during the crisis due to their commodity exports to China, their job market is apparently as dreadful as ours. The Age details an index that I had not been previously aware of:

Skilled vacancies dropped 7 per cent in May, according to the latest Government data, easing the pace in declines for the nation's jobs outlook.

The slump follows a 8.9 per cent fall in the April reading of the index, compiled by the Department of Education, Employment and Workplace Relations. It marks the 18th consecutive month of falls, as the nation struggles with weak demand for workers triggered by the recession after an earlier shortage of skilled workers put a lid on hiring at the height of the economic boom.

The DEWR vacancies index, compiled from job ads in major metropolitan newspapers across the country, is a leading indicator of the labour market.

"The monthly fall in skilled vacancies was widespread, with decreases evident across most occupations," DEWR said, with medical and science technical officers down by 20 per cent.
Taking a look at this job index by sector and sub-sector (in year over year terms) we see that no area has truly been safe (with the interesting exception being marketing and advertising).


Source: Workplace.Gov.AU

No EconomPic Needed to Explain this Greed

The WSJ reports:

Banking trade groups are lobbying the Federal Deposit Insurance Corp. for permission to bid on the same assets that the banks would put up for sale as part of the government's Public Private Investment Program.

PPIP was hatched by the Obama administration as a way for banks to sell hard-to-value loans and securities to private investors, who would get financial aid as an enticement to help them unclog bank balance sheets. The program, expected to start this summer, will get as much as $100 billion in taxpayer-funded capital. That could increase to more than $500 billion in purchasing power with participation from private investors and FDIC financing.

The lobbying push is aimed at the Legacy Loans Program, which will use about half of the government's overall PPIP infusion to facilitate the sale of whole loans such as residential and commercial mortgages.

Federal officials haven't specified whether banks will be allowed to both buy and sell loans, but a list released by the FDIC and Treasury Department of the types of financial firms likely to be buyers made no mention of banks.

Allowing banks to have it both ways would give them added incentive to sell assets at low prices, even at a loss, the banks contend. They claim it also would free up capital by moving the assets off balance sheets, spurring more lending.

"Banks may be more willing to accept a lower initial price if they and their shareholders have a meaningful opportunity to share in the upside," Norman R. Nelson, general counsel of the Clearing House Association LLC, wrote in a letter to the FDIC last month.

Off balance sheet only frees up capital because it hides risks. This is absolutely mind boggling. Not the fact that they are asking, but how is this even a remote possibility?

Where's the Dollar Going?

WSJ reports:

"I think people are trying to figure out, after last week, whether or not that was the signal the (U.S. dollar) is headed lower," said David Watt, senior currency strategist at RBC Capital Markets in Toronto.

"Right now, it's not clear," he said.

While some analysts have argued last week's turn against the dollar reflects a pivotal shift in sentiment, uncertainty continues to cloud prospects for the economy, equity markets and the U.S. currency, and the dollar could rebound from recent selling, Watt said.

A report from Custom House, a currency services firm based in Victoria, British Columbia, said there may be a slight sense in currency markets that the relentless dollar selling last week was a bit overdone, and traders may not be quite as confident holding short dollar positions now as they were last week, when it seemed to be a one-way bet against the U.S. currency.
Warning: I am not a currency expert, BUT while the media has been calling the recent dollar move a sell-off (or Euro rebound) that is in regards to a VERY short time frame. Over the longer term, the Euro is still down 10% over the past year, thus don't write-off a continued sell-off / Euro rebound from here.


Source: Yahoo

Tuesday, May 26, 2009

Can We Inflate Our Way out of this Mess?

Three ways the U.S. can decrease the level of nominal debt as a percent of GDP:

  • Default (not going to happen... at least while we still own the printing press)
  • Increase productivity (and GDP), while paying down or maintaining the debt load
  • Inflate our way out of it (decreases the value of debt in real terms)
Of the three, in theory, inflating our way out of it will be the easiest, as it does not require true real economic growth. In Wolfgang Munchau's recent FT article 'We Cannot Inflate our Way out of this Crisis' he states that it may not be all that easy after all. Wolfgang details:
Of course, it can be done, but only for as long as the commitment to higher inflation is credible. Inflation is not some lightbulb that a central bank can switch on and off. It works through expectations. If the Fed were to impose a long-term inflation target of, say, 6 per cent, then I am sure it would achieve that target eventually. People and markets might not find the new target credible at first but if the central bank were consistent, expectations would eventually adjust. In the end, workers would demand wage increases of at least 6 per cent each year and companies would strive to raise their prices by that amount.
Yves at Naked Capitalism agrees that it is a challenge, but possibly due to a different reason:
You may have noticed a crucial assumption...."workers will demand wage increases." Pray tell, how? Workers have no bargaining power in the US. Merely goosing interest rates does not a a tight labor market make.

Stagflation was seen as impossible until it took place. I wonder if we could wind up with rising bond yields due to concerns about large fiscal deficits, with a lower rate of goods inflation due to the lack of cost push (wages are a significant component of the cost of most goods, save highly capital intensive ones). In fact, we could see stagnant nominal wages with mildly positive inflation, which means wage deflation. If that was also accompanied by high yields, you would have much of the bad effects of debt deflation per Irving Fisher (high real yields and reduced ability to service debt) since real incomes would be falling in the most indebted cohort.
The key point is that in the current environment, workers have no power. While we all know about the spike in the unemployment rate, the other side of the story is the cliff dive in the number of new job openings. The odd thing is I first became fully aware of this information in Sunday's NY Times article Bleak Picture, Yes, But Help Still Wanted that made the case that the market was actually FULL of opportunity.
Consider that in March, nearly 700,000 jobs disappeared. But now consider this: At the end of March, there were 2.7 million job openings. What tends to get lost in the data picture is that just as some companies are laying off workers, other companies are hiring. In fact, the business world is changing at such a dizzying rate that some companies are cutting and hiring workers at the same time.
Uh.... no. 2.7 million is down from 4.8 million openings as recent as the Summer of 2007; when 6 million less people were unemployed. In other words, the number of job openings has halved, while the number of those unemployed has doubled. That is not "bleak"... that is frightening.


This in turn has pushed the number of unemployed, as a percent of job openings, up more than three-fold to 500%. Yes, for each opening... 5 people want that job. That my friends is why, as Yves points out, workers don't have ANY bargaining power.


Thus, the concern I have is that inflation won't be driven through via wage increases (where at least workers salaries are keeping up), but by a spike in the price of commodities. If inflation concerns = dollar concerns = commodity spike, then that impossible stagflation may be possible once again.

Source: BLS

Consumer Confidence Spike


"CSPI" March

Swapping out the Owner's Equivalent Rent in the CPI with Case Shiller's Composite 10 Home Price Index, we see the continued downward pressure in price levels.


I make the case that this is more applicable a price index for someone looking to buy a home in the current market.

Long Bond Volatility

If you've been gone for 9 months, you've missed nothing... the 30 year bond is still at 4.4%... yawn.


Source: Yahoo

How Many Runs is the U.S. Down and What Inning is It?

This post may seem off topic, but it shows how important it is never to write off the impossible.

Yahoo Sports reports (bold mine):

Victor Martinez lined a two-run single with two outs to cap a seven-run ninth inning as the Cleveland Indians overcame a 10-run deficit to beat the Tampa Bay Rays 11-10 on Monday night.


Now if only the U.S. can show this sort of comeback!

Source: Yahoo

Monday, May 25, 2009

German Business Confidence at All Time Low... "Optimism" Abounds

Another 'When "It Can't Possible Get Worse than This" is a Good Thing'.

The AFP reports:

German business confidence rose to a six-month high in May, a key sentiment index showed on Monday, suggesting that Europe's top economy might be pulling out of its worst slump in over 60 years. The closely watched Ifo indicator rose for a second consecutive month to 84.2 points from 83.7 points in April, adding to evidence that sentiment is again on the up in Germany, the world's biggest exporter.

The result was slightly worse than expected, however. Analysts surveyed by Dow Jones Newswires had expected the index to rise to 85 points. Economists see the index as a key leading indicator to gauge the future health of the economy. It had been falling steadily -- with occasional blips -- since June 2008 as sentiment firms plummeted due to the global financial crisis.

Tempering the optimism, however, was a sub-index showing that companies' view of the current situation in Germany dropped in May to 82.5 points, its lowest level ever. Rees said this sub-index showed that the German economy was unlikely to recover from the slump as quickly as it plunged into it.
Index


Business Balances


Source: Ifo Institute

Friday, May 22, 2009

EconomPics of the Week: Long (Well Deserved) Weekend Edition (5/22/09)

Opinion
The End of the Private Sector Boom?
High Quality Credit Risk vs. Duration Risk
Continuing Claims Continues Climb
Why the Oil Spike?

Economic Data
Leading Economic Indicators “Surge” in April
United States of Autos
Housing Starts at Record Low... Permits Follow
CPI: The Transportation Story

Global
United Kingdom's Negative Rating Outlook
Japanese Economy Crashes... Hard
United Kingdom Deflation Alert
Russia Sheds Dollars for Euros
When "It Can't Possible Get Worse than This" is a Good Thing
India Equity Markets Soar

Assets / Markets
Oil Spike a Result of Dollar Weakness? Not Necessarily
Banks Continue to Rip, rather than R.I.P.
Fixed Income's Sharp Reversal
Bank Brand Value... Then and Now

Greed
Apple: Greedy and/or Complacent
The Wolf in Sheep's Clothing

High Quality Credit Risk vs. Duration Risk

As the yield on the 30 Year Treasury has spiked in recent months from a low of 2.5% all the way up to 4.3%, the yield to worst on the Barclays Aggregate Bond Index (i.e. formerly the Lehman Brothers Aggregate Bond Index - a blend of intermediate bonds made up by ~1/3 Agency Mortgage Bonds, ~1/3 Treasuries, ~1/3 Investment Grade Corporate Bonds) has tightened to 3.9% from over 5.5% as recently as October.


In other words, the appetite for "high quality spread" has increased relative to duration (i.e. interest rate) risk, thus bringing down the required return of intermediate bonds relative to the 30 year Treasury. If this 3.9% yield results in dissatisfaction for those risk taking investors, then it may mean a rotation to equities and/or higher risk assets.

While I personally am still vehemently opposed to investing in equities at this time (I can't look at the fundamentals of the economy in its current state and put my money at risk at the bottom of the capital structure REGARDLESS of valuation), the chart below tells a different story. The chart shows the difference between the 30 Year Treasury Bond's yield and the yield to worst for the Aggregate Bond Index, against the one year forward return on the S&P 500 and we do see a relationship.


When the spread turned negative (i.e. investors were less worried about duration risk, then taking on spread risk) it looks like equities underperformed in the ensuing 12 months, possibly as institutional investors reallocated from equities to greater yielding credit. On the other hand when the spread turned positive (such as today), investors became increasingly worried about duration risk and moved to equities.

There is, as always, a "this time is different" caveat. Much of the reason for this high quality spread tightening has been technical in nature as the Fed and Treasury continue to throw money at all the economy's problems. Both Agency MBS (the Fed is actively buying mortgages) and Investment Grade Bonds (think TARP injections to financials) have benefitted by this money at the margin.

And all that money comes at a cost... new Treasury sales and higher Treasury yields.

Oil Spike a Result of Dollar Weakness? Not Necessarily

In my post about the run up in the price of oil, I received the following comment:

Dollar weakness was left out of all of those explanations. Since the quantitative easing program hit high gear around March 19th, the price geometry has been constructive (minus one correction mid-rally -- few, if any rallies go straight up). Graph the dollar index or euro-dollar trade against a crude oil chart. You will see significant pressure of late due to concerns of firming inflation on the forward curve.
Since March 19th the Euro is up "only" 1.7% against the dollar (all of which took place the last two days). And while I do agree that a strong or weak dollar can and will impact the price of oil over the long run, I don't necessarily buy it as a reason in the short run. One reason, if the oil rally were due to a decline in the dollar, oil wouldn't have outperformed a "better" store of value (i.e. gold) over that same time frame.

Gold / Oil Ratio; May 2006 Index = 1

In looking at the chart above, we see the two were extremely correlated until the global economy blew up last Fall and gold outperformed by a factor of 4. Oil has shown a strong comeback since that time. And since that March 19th quantitative easing date?
  • Oil is up 10%
  • Gold is flat
What I do find as an intriguing theory is that in "uber-real" terms (i.e. the price of gold), oil overshot to the downside. Thus, while oil has rallied rather significantly over the past three months, it is just mean reversion from this oversold territory.

*Note the above chart is inexact as it uses the ETF's
GLD and USO as representatives for gold and oil respectively (I am working from home ahead of the long holiday weekend - i.e. no Bloomberg).

Update:
Could this be another reason?

Thursday, May 21, 2009

The End of the Private Sector Boom?

As many people work in the U.S. private sector today (on an absolute basis) as ten years ago.


This result is even more shocking when you take into account that the "working population" is about 20% larger than it was in 1999. Before we dive further into the data, lets first define what the "working population" (i.e. civilian noninstitutional population) is:

The civilian noninstitutional population consists of persons 16 years of age and older residing in the 50 States and the District of Columbia who are not inmates of institutions (for example, penal and mental facilities and homes for the aged) and who are not on active duty in the Armed Forces. California is the most populous State, with about 27.9 million persons in this category in 2008; Wyoming is the least populous State, with just over 410,000 persons.
As a percent of this population, private workers ramped up from right around 38% in the early 1960's to OVER 50% as recently as the summer of 2002 (partially as a result of the two income family becoming the norm, rather than the exception). Since then, the number has dropped to just over 46% of the population.


In other words (and another way of saying the same thing); the majority of people able to work, no longer do so in private industry.


My thoughts... a large portion of the economic growth that took place over the past generation occurred because the workforce was increasing (in private industry) each year. Even if this additional employee was less productive on the margin, they built the overall economic pie. As mentioned this trend hasn't only slowed, it has reversed.

The problem (in theory) is that private workers are the true "producers" of this nation, whereas public workers tend to maintain / build the structure that lets these producers function (i.e. they provide public goods). My worry is that we lost a substantial number of these productive jobs over the past ten years to eager and willing overseas competition.

I am not implying they were "stolen", as stolen would mean we wanted them. Over the past 10-20 years Americans have willingly handed off jobs in science, manufacturing, and programming as it was seen as more exciting / easy to be a real estate agent, financier, or day trader (hey, I'm guilty!). The problem is that many of these jobs didn't truly add to the overall pie, but took away from it by adding another cost to the supply chain.

Now that asset prices aren't continuing their upward trend, we are realizing that many of these jobs may not have even been necessary. To be very draconian, the question becomes whether we are qualified to get these jobs back.

Source: BLS

Update:

Scroll up and look at the top chart, then go to The Big Picture and take a look at the leading measure of commercial real estate... that's a helluva relationship.

Leading Economic Indicators Surge in April

And by surge I mean down 5% year over year.

Bloomberg reports on the recent jump:

The index of U.S. leading economic indicators rose more than forecast in April, a sign the deepest slump in at least half a century is easing. The Conference Board’s gauge increased 1 percent, the biggest gain since November 2005, after a 0.2 percent drop in March, the New York-based group said today.

The index points to the direction of the economy over the next three to six months. Rising stock prices and improving consumer confidence are among the components of the leading index that are stoking speculation the economy will begin to grow again in the next six months. Still, with unemployment at a 25-year high and projected to keep climbing into 2010, and lenders restricting credit, the recovery may be muted.


Update:
An anonymous poster noticed what I was getting at in the first sentence of this post.
The spin seems to be getting worse, if that's possible. Titanic sinks. Port of NY less crowded.
Source: Conference Board

Continuing Claims Continues Climb

The number of fired less hired (think the increase in continuing claims) continues to grow exponentially. The importance of this on the broader economy was laid out here.


Reuters with the details:

The most severe U.S. recession in decades has already cost over 5 million jobs since it began in late 2007, and despite some recent indications that employment conditions might be stabilizing, the labor market remains in dire shape.

The number of people staying on the benefits roll after drawing an initial week of aid increased by 75,000 to a more-then-forecast 6.662 million in the week ended May 9, the most recent week for which data is available. Analysts estimated so-called continued claims would be 6.65 million.

Source: DOL

Update
Credit Writedowns continues to have a well thought out, but differing point of view.

United Kingdom's Negative Rating Outlook

Across the Curve details:

S and P has maintained it AAA rating on 19th century superpower, the United Kingdom, but has revised its outlook to negative. S and P cited the country’s increasing debt burden for the move.
Here's a chart (from a recycled post) showing the way Moody's thinks about sovereign risk.


Looks like we can update the United Kingdom as a vulnerable country.

United States of Autos

The WSJ reports:

The Treasury Department is poised to inject more than $7 billion into GMAC LLC, the first installment of a new government aid package that could reach $14 billion, according to people familiar with the matter.

As a result of the move, the government within months could end up owning both GMAC and General Motors Corp. The GM plan being devised by President Barack Obama's auto task force calls for the government to emerge with a majority stake. And the increasing infusion of taxpayer money into GMAC could turn the U.S. government into a majority shareholder there.

The GMAC injection is designed to firm up the auto-financing company's battered balance sheet and allow it to continue making loans for car purchases at GM and Chrysler LLC. The Treasury already put $5 billion into GMAC in December.

The GMAC funding is an illustration of how rapidly the government effort to rescue the U.S. auto industry is escalating in cost and scope. What began as an emergency batch of loans to GM, Chrysler and GMAC in December -- totaling just over $20 billion -- now looks likely to balloon well beyond $50 billion and could approach $100 billion by the end of the year.
Rapidly? That implies the $20B, which was ramped up to $25B by the time I wrote the post Ener-GM Bail last August, was small in size. I put the initial $25B loan subsidy at:
25 * 129.4M = $3.23B / year if the loans are paid back in full
The if because I doubted the autos could even pay back those subsidized loans after their massive sales drop from 2007 to 2008 (though that fall now looks like a drop in a pond compared to the recent collapse).


Heck (haven't used the word heck in a while) by only September of last year it was VERY apparent the $25B wasn't enough (see When $25 Billion is Chump Change).

Does anyone think that the additional $7.5 Billion will be all they need?

Source: Autoblog

Wednesday, May 20, 2009

Why the Oil Spike?

The Poor Explanation (i.e. a current supply issue)

Reuters:

U.S. crude oil futures rose more than $2 per barrel on Wednesday, pushing to a 2009 front-month intraday peak above $62 a barrel as the government reported crude oil and gasoline inventories fell last week.
We've heard this with every release. Inventory build? It was less than expected. Inventory fall? Demand spiked in the short-term. Uh... no. Supply has risen dramatically over the past six months with a SLIGHT fall (can't hardly see it) last week.


The Better Explanation

WSJ:

Energy investment is "plunging" because of the recession, paving the way for oil-price surges within three years, the International Energy Agency warned in a new report.

The Paris-based watchdog for the world's major energy-consuming nations said that in recent months, oil companies and investors have canceled or postponed about $170 billion of investment equivalent to roughly two million barrels a day in future oil supply.

An additional 4.2 million barrels a day in future oil-supply capacity has been delayed by at least 18 months as companies slash spending.

And the Counter-Argument (i.e. the run up has just been speculative)

Individual Global Investor:

Supply stabilizing but demand is still falling. The cross over point in mid 2008 was reached partially because of increased supply but also because U.S. demand consumption, which had peaked in December 2007, began a decline that has yet to cease. Since that period, the world has been in a steady decline as one region after another throughout 2008 peaked in their consumption of energy. Supply has been curtailed, mostly by OPEC output cuts but demand has continued to fall faster.

As reported last week, OPEC supply is no longer falling yet the demand outlook from the International Energy Agency continues to weaken. Oil producers once before tried to hold production constant last November in the face of falling demand and rising inventories. What followed was a sharp drop in crude oil prices from the low $50/bbl range to a recent low of $32/bbl in the final week of the year.

Source: EIA

Banks Continue to Rip, rather than R.I.P.


Source: Yahoo

When "It Can't Possible Get Worse than This" is a Good Thing

Reuters with the details of yesterday's ZEW Indicator (that's a new one for me):

The euro briefly jumped to a session high while Bund futures extended losses on Tuesday after a poll by a major German economic think tank showed that sentiment on the country's economy is improving more than expected.

A monthly poll by Germany's ZEW institute showed that its economic sentiment index rose to 31.1 in May, higher than forecasts for a 20.0 reading and improving from 13.0 in April.


That's right... markets were up because although NOBODY (literally, not one?) thought things were good now, some are beginning to think it can't possibly get worse.

Source: ZEW

Tuesday, May 19, 2009

Japanese Economy Crashes... Hard

Can't wait to hear how this awful release contained some green shoots. My guess is "this marks a bottom", but don't count out "imports were down". Bloomberg details:

Japan’s economy shrank at a record 15.2 percent annual pace last quarter as exports collapsed and consumers and businesses cut spending.

The contraction followed a revised fourth-quarter drop of 14.4 percent, the Cabinet Office said today in Tokyo. Gross domestic product fell 3.5 percent in the year ended March 31, the most since records began in 1955, confirming that the recession is Japan’s worst in the postwar era.

Exports plunged an unprecedented 26 percent last quarter, forcing companies from Toyota Motor Corp. to Hitachi Ltd. to cut production, workers and wages. Stocks have gained 32 percent since reaching 26-year low in March on speculation worldwide interest-rate reductions and spending by governments will halt the slide in the world’s second-largest economy.
Two areas of "growth" were imports (or the lack thereof - i.e. addition by less subtraction) and government consumption (well... sorta - it's that small light blue speck).


My overall take... whenever exports detract 10% and 15%, in back to back quarters, from an "export nation", things are worrisome.

Update: The Financial Times went with Green Shoot #1 (hat tip Naked Capitalism):
However, with government spending growing, inventories falling and exports expected to stabilise after falling a record 26 per cent between January and March, many analysts believe that the worst is over and the economy could already have returned to growth in the current quarter.

Drastic production cuts by Japanese manufacturers have finally succeeded in outpacing the collapse in demand, Wednesday’s data showed, with destocking of inventories contributing a negative 0.3 percentage points to GDP growth in the first quarter.

While such inventory reduction made the headline GDP figure look even worse, it means that companies are making progress in clearing their decks and should soon be able to increase production to meet actual demand.
Source: esri.cao.go.jp

Bank Brand Value... Then and Now

Felix Salmon with the details:

The changes are staggering. Last year, the two most valuable financial brands in the world were Bank of America and Citi; this year, BofA is in 8th place, while Citi’s not even in the top ten any more. Both have lost more than half their brand value in the space of one year. Last year, four of the top five banks were US-based; this year, the top four comprise three Chinese banks and a fourth with the China-centric name of Hongkong and Shanghai Banking Corporation. Last year’s top 20 is this year’s top 15, despite the arrival of Visa (with a valuation which is now good for 5th place, but which would have got it only 10th place last year).
Below is a chart of the top 9 from 2008 (#10 was Deutsche Bank, which fell out of the top 15 in 2009) vs. 2009.

Housing Starts at Record Low... Permits Follow

First of all, I think this is a good thing. With record inventory why are people rooting for additional supply? Bloomberg reports:

Builders broke ground on the fewest homes on record in April as work on multifamily units plunged, a sign that sales and home prices may have farther to fall before the housing market reaches a bottom.

The 13 percent decrease to an annual rate of 458,000 was led by a 46 percent decline in multifamily starts and followed a 525,000 pace the prior month, the Commerce Department said today in Washington. Building permits, a sign of future construction, fell 3.3 percent to a record low pace of 494,000.


Source: Census

United Kingdom Deflation Alert

Bloomberg reports:

U.K. inflation slowed more than economists forecast in April to the weakest level in 15 months as the recession undermined price pressures in the economy.

Consumer prices rose 2.3 percent from a year earlier, the Office for National Statistics said today in London. The median forecast in a Bloomberg News survey of 28 economists was 2.4 percent. The retail price index measure of inflation dropped an annual 1.2 percent, the most since records began in 1948.

Russia Sheds Dollars for Euros

The Moscow Times (via Brad Setser)

The euro's share in Russia's forex reserves, the world's third-largest, overtook that of the dollar last year as the country pressed on with a gradual diversification, the Central Bank's annual report showed.

The euro's share increased to 47.5 percent as of Jan. 1 from 42.4 percent a year ago, according to the report, which was submitted to the State Duma on Monday.

The dollar's share fell to 41.5 percent from 47 percent at the start of 2008 and 49 percent at the start of 2007.


As Brad points out:
It is often asserted that the dollar is the global reserve currency. It would be more accurate to say the dollar is the globe’s leading reserve currency.* The dollar is the dominant reserve currency in Northeast Asia. And the two big economies of Northeast Asia both happen to both hold far more reserves than either really needs. The dollar is also the reserve currency of the Gulf. And Latin America.**

But the dollar isn’t the dominant reserve currency along the periphery of the eurozone. Most European countries that aren’t part of the euro area now keep most of their reserves in euros. That makes sense. Most trade far more with Europe than the US – and some, especially in Eastern Europe, ultimately want to join the eurozone.

* The rise in global reserves means that the world’s central banks hold more euros as part of their reserves now than they held dollars in 2000. If demand for dollars hadn’t risen any more, the rise in demand for euro-denominated reserves would be a big story …

** Best that I can tell, South and Southeast Asia generally hold a far lower share of their reserves in dollars than the big countries in Northeast Asia.
Go read his whole piece here

Monday, May 18, 2009

Apple: Greedy and/or Complacent

I enjoy Greenday from my youth (Dookie was released just as I was becoming an expert at being a "bored teenager"), thus I took a look at purchasing the new album from the I-Tunes Store. I was taken aback by the price ($14.99! CD's USED to cost $14.99, but downloads in 2009?). So, I decided to take a look at Amazon MP3. Same album and an automatic load to I-Tunes for... $4.99.


Has Apple's dominance made it complacent or do they have the ability to overcharge users by 300% purely because people are too lazy to search for a better deal? While I do love my IPhone and IPod, I know where I'll be going to for music going forward.

The Wolf in Sheep's Clothing

According to Wikipedia, a conflict of interest occurs when:

An individual or organization (such as a policeman, lawyer, insurance adjuster, politician, engineer, executive, director of a corporation, medical research scientist, physician, writer, editor, or an individual or organization cited as a source) has an interest that might compromise their reliability. A conflict of interest exists even if no improper act results from it, and can create an appearance of impropriety that can undermine confidence in the conflicted individual or organization.
The Times of London has a long piece on the AIG fiasco titled 'Joseph Cassano: the man with the trillion-dollar price on his head'. This portion caught by attention and is the first example of a conflict of interest:
In the final three months of 2007, AIG lost over $5 billion. Under the terms of the bonus scheme, top executives should have had their pay cut for poor performance. When the compensation committee met in March 2008 to award bonuses, however, the Essex-born CEO urged it to ignore the losses. The board approved the change, even though losses were growing by the month, and Sullivan pocketed $5.4m. He was also awarded a golden parachute worth $15m. He was out of the company three months later, with a severance package worth $47m (£31m). That is $39,500 (£26,000) for every day he was in charge. Pension funds and other savers holding AIG shares lost $58.4m (£39m) a day during his tenure.


So he could take all that risk knowing that if it all went awry he'd leave with plenty of money.

And for additional example, lets go back to the article:
Cassano’s division then imploded. As house prices fell, credit ratings were cut and bankers began to panic, AIG posted the biggest quarterly loss in corporate history: $61.7 billion. This is equivalent to losing $28m (£19m) an hour, every hour, for the final three months of 2008. But by now, the company’s problems were the property of the American taxpayer, creating extraordinary new conflicts of interest. Hank Paulson, the Treasury secretary in the outgoing Bush administration, was an ex-CEO of Goldman Sachs. He received tax benefits of about $200m (£133m) for taking on a government role. When the US decided to bail out AIG, the chief beneficiary of the rescue was… Goldman Sachs, which received $12.9 billion of public funds via the insurer. The new CEO, Edward Liddy, whose task is to wind down the company and to close $1.6 trillion in trades that are still outstanding from the Cassano era, is ex-Goldman Sachs. He even has $3.2m in the bank’s shares.
Am I the only one who sees a parallel between the above and the story of the wolf in sheep's clothing?

Fixed Income's Sharp Reversal

A massive reversal in the fixed income market with the high yield index up a WHOPPING 20%+ year to date.


What's so amazing is how fast the reversal has taken place considering most of the underperformance in the credit market didn't really occur until September 2008.


And now... the sell-off and rebound which was technical in nature (i.e. forced selling / opportunistic buying), now becomes a question as to the fundamental value of the security.

Source: Barclays Capital

CPI: TheTransportation Story

In response to last week's post on CPI, an anonymous reader asked:

Can you annualise the month over month CPI data? When you put the month over month data along with the year over year data, I can hardly distinguish which is which.
My response:
That's kind of the point. these changes ARE tiny (but the media makes it out to be of huge importance). The much more important figures are the year over year changes because they show the actual trend; which has generally been deflationary.
Breaking out the trend in year over year terms, we see the dominant "driver"... transportation (how's that for a play on words?). While I've been remarking that transportation was the main reason for last years spike (and this years fall) in inflation before, I am quite surprised at the relative stability for all the other categories.

Contribution to CPI


By Category (Rolling Year over Year Change)


Source: BLS

India Equity Markets Soar

Marketwatch reports:

A surge in Indian share prices following a decisive election victory by the Congress Party-led coalition over the weekend helped turn around other markets in Asia Monday.

Trading in Indian stocks was halted Monday after shares in key benchmarks surged more than 17% -- triggering market circuit breaker rules.

India's surge helped boost sentiment in other regional markets. While Japanese shares closed lower, before the start of Indian trading, exchanges open later, including Hong Kong, Shanghai and Singapore all ended higher.

The Sensex closed 17.3% higher at 14,284.21, while the 50-stock S&P CNX Nifty rallied 17.7% to 4,323.15.

"The election in India is showing a clear mandate there, and probably underlines to a lot of investors there that Asia is going to be the growth area for the next six to nine months, whereas growth in Europe and U.S. could take much longer," said Andrew Sullivan, a sales trader at Main First Securities in Hong Kong.


Source: Yahoo

Friday, May 15, 2009

EconomPics of the Week (5/15/09)

Economic Data
Capacity Utilization at Lowest Level Since 1967
Empire State Manufacturing
YoY CPI Drops Most Since 1955
Producers Price Index (April)
A Decline in Retail Sales is a "Surprise"... Really?
Trade Balance Flat in March
Unwanted Part Time Worker Spike

Non-US
Europe Crushed... GDP Down 2.5% QoQ
Fighting "Deflation" Irish
Japanese Exports to China > to U.S.
Chinese Exports: "Second Derivative" Turns Negative
Chinese CPI Still Negative

Sports / Random
Yankees Economics
The Second Derivative of Green Shoots is Positive!
Watch out Hack Wilson
Government Receipts Down 34% Year over Year
It Pays to Lobby
We're All Euro Now: Government Spending at 45% of GDP

Asset Classes / Markets
Yield Curve to Predict Equity Markets? Yes and No
Financials Rocketed, But Is There Any Fuel Left?
Coffee Crisis? Not really...

Capacity Utilization at Lowest Level Since 1967

WSJ reports:


U.S. industrial production tumbled a 15th time in 16 months during April, cut down by massive business inventory liquidation.

Industrial production decreased by 0.5% in April compared to the prior month, the Federal Reserve said Friday. Output fell 1.7% in March, revised from a previously estimated 1.5% decline.

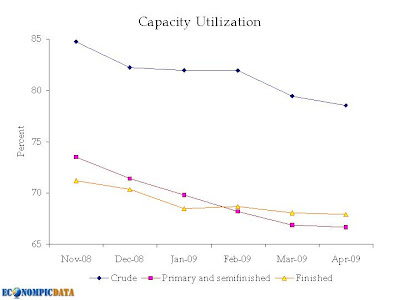
Capacity utilization shrank in April to 69.1%, a historical low since records began in 1967. March capacity use was a revised 69.4%; originally, "cap-U" was estimated at 69.3% in March. The 1972-2008 average was 80.9%.

Industrial Production

Capacity Utilization