Tuesday, June 30, 2009

Consumer Diffidence

Yeah, I didn't know what diffidence meant either...

Bloomberg reports:

Confidence among U.S. consumers slipped unexpectedly in June, reflecting a weak labor market.

The Conference Board’s sentiment index decreased to 49.3 from a revised 54.8 in May, the New York-based research group said today. The figure was still above a record low of 25.3 reached in February. Another report showed home prices fell at a slower pace in April than in the previous month.

“The optimism that started to build over the last few months may be starting to fade,” Michael Gregory, a senior economist at BMO Capital Markets in Toronto, said before the report. “Labor markets are sort of stabilizing in terms of job losses, but the big issue is people are having a hard time finding a job.”


Source: Conference Board

Home Prices are "Less Worse"

Bloomberg reports:

Home prices in 20 major U.S. metropolitan areas fell in April at a slower pace than forecast, a sign the plunge in real-estate values is abating.

The S&P/Case-Shiller home-price index decreased 18.1 percent from a year earlier following an 18.7 percent drop in March. The measure declined 19 percent in January, the most since the data began in 2001.

Price declines are likely to keep moderating as demand steadies and distressed properties account for a smaller share of transactions. Still, the highest jobless rate in 25 years is contributing to record foreclosures, which are likely to keep depressing values for months to come even as home sales steady.

Below is a chart of the second derivative in year over year change (i.e. April year over year change less March year over year change).


It looks like some of the worst hit markets are beginning to bottom (California and Florida to be more specific).

Source: S&P

U.K. Post Largest GDP Drop in 50 Years

WSJ reports:

The U.K. economy posted its sharpest decline in more than 50 years in the first quarter, suggesting the recession has been even harsher than previously thought, the Office for National Statistics said Tuesday.

The ONS said the economy slumped a downwardly revised 2.4% in the first quarter, which was narrowly the largest decline since the second quarter of 1958. The annual decline in output was 4.9%, the largest since records began in 1948. Economists had expected a smaller downward revision in the first-quarter gross domestic product data. In a Dow Jones Newswires survey last week, they forecast the economy would shrink 2.2% from the previous quarter and 4.4% from a year earlier.


Source: BLS

Top Bank Losses

The Banker (via The Big Picture):

The shocking 85.3% collapse in profits reveals the full extent of the carnage in the global banking system. After four years of above 20% profit growth, last year’s figure, based on full-year 2007 figures, stayed relatively flat with a loss of 0.7%. Because aggregate bank profitability (total pre-tax profits to total Tier 1 capital) was still a handsome 20% in 2008’s ranking (slipping from a record 23.4% in 2007), it was hoped that healthier parts of the financial system would be able to offset losses in US and Europe.

This year, however, aggregate profitability has sunk to just 2.69%.

For the first time in the Top 1000’s 39-year history, the top 25 banks – which account for almost 40% of the Top 1000’s Tier 1 capital and almost 45% of its total assets – recorded a loss, which totalled $32.37bn (-28.1% of Top 1000 profits). Stripping out the profits of the lower reaches of the Top 25 means that the top five banks fared even worse. Representing 13.4% of total Tier 1 capital and 12.3% of total assets, the top five banks lost a staggering $95.8bn (-83.3% of total profits).
Below is a chart of the top 10 losses.


Citi came in a close second. Don't give up Citi... there is always 2010.

Source: The Banker

Monday, June 29, 2009

Japan: 2.3 Applicants for EVERY Job Opening

Wonder why there is record deflation in Japan? Look no further than the job market to see why there is a HUGE lack of demand for goods. Bloomberg reports:

“The pressure to cut jobs is strong,” Jun Saito, chief economist at the Cabinet Office, said last week. Weak global demand means exports may not be strong enough to make up for the deteriorating job market at home, he said in an interview.

The ratio of positions available to each applicant dropped to 0.44, the lowest since the survey began in 1963, the Labor Ministry said. Data yesterday showed retail sales dropped 2.8 percent in May from a year earlier, the ninth monthly decline.

“The job-to-applicant ratio was really eye catching -- the data was horrible,” said Mari Iwashita, chief market economist at Daiwa Securities SMBC Co. in Tokyo. “The jump in household consumption is only a frontloading of spending.”


Think that 2.3 number is scary? Well, the U.S. currently has 5 applicants for EVERY job opening.

Source: Stat.GO.JP

R.I.P. U.S. Consumer

Credit for the chart below goes to Wall Street Bear.


And where'd that money go (I used rolling 12-month as the monthly data is too choppy)?


Before you celebrate the fact that the savings will be consumption at some point in the future, think again. Per Market Ticker:

"Saving", by the way, includes debt paydowns; the government in its "infinite wisdom" computes the "savings rate" as "income less spending", which is not actually correct; money that goes from income to paying down debt isn't "saved". This increase shows that consumers continue to reduce borrowing activity (out of both choice and necessity) and are desperately trying to tread water in their sea of debt (never mind the occasional shark that comes by for a snack!)
Owe Jesse makes the case that reduced debt burden is just as good as savings and I will agree to that (and I'll admit I overlooked that). My thinking was related to the amount "saved" due to the making of interest payments that don't reduce an individuals debt burden. In that case, I don't see the net benefit going forward.

Source: BEA

Freddie Mac Delinquencies Increase at Increasing Rate

Bronte Capital with the implications:

I have been firmly in the “second derivative is good” camp for some time. Green shoots were few and far between – but the economy no longer appeared to be in free-fall. When the free-fall stopped it was time to buy equities – and whilst it was not time to ease up on the looser monetary and fiscal policies – it may have been sensible to limit them somewhere near the levels that they now are.

The data I considered most persuasive was the delinquency data at Fannie and Freddie. It gets worse every month, but until the last data point it was getting worse at a decreasing rate (especially if you adjusted for the foreclosure moratoriums they implemented).
Delinquency Rates of Freddie Loans

Today I am more worried. My favourite data point (rate of increase of Freddie Mac delinquency) has deteriorated – especially in their insured portfolio. Its not sharp deterioration – and it is possible – even likely – that Freddie Mac will have end credit losses considerably lower than the bears anticipate. But as a second derivative bull I am feeling just that little bit less certain.
Three Month Change in Delinquencies


Source: Freddie Mac

"More Than Meets the Eye" at the Box Office

Box Office Guru with the details:

Robots ruled the box office as the highly-anticipated action sequel Transformers: Revenge of the Fallen generated the second biggest opening in history with a gargantuan $201.2M in its first five days, according to studio estimates, sending the overall marketplace to its highest gross of the year. The eye-popping figure included $112M over the traditional Friday-to-Sunday period plus an additional $89.2M since its Wednesday launch. Playing ultrawide in 4,234 theaters including 169 IMAX screens, the Paramount release averaged a stunning $26,453 over the Friday-to-Sunday period and a gigantic $47,531 over five days.

The only other film to ever gross more in its first five days was last summer's The Dark Knight which hauled in a slightly better $203.8M from 4,366 venues. The first Transformers bowed to $155.4M in 6.5 days and needed 12.5 days to break the double-century mark on its way to a $319.2M finish.

The Michael Bay-directed pic set a number of other box office milestones. It set new records for a June opener, beating the $93.7M of 2004's Harry Potter and the Prisoner of Azkaban, and for a live-action film from Paramount exceeding the $100.1M of last summer's Indiana Jones and the Kingdom of the Crystal Skull.


This continues 2009's hot streak (why spend money on a vacation when you can see a terrible movie about robots?)


Source: Box Office Mojo

Sunday, June 28, 2009

Japanese Industrial Production Jumps, But Still Down 30% YoY

Bloomberg reports:

Japan’s industrial output rose for a third month in May as companies rebuilt inventories and the economy started to climb out of its deepest postwar recession.

Production climbed 5.9 percent from a month earlier, the Trade Ministry said today in Tokyo, the same pace as April, which was the biggest gain since 1953. Economists surveyed by Bloomberg predicted a 6.9 percent increase, and factories were still producing 29.5 percent less than last year.


One of the largest areas of industrial production in Japan is production of passenger cars, which makes up ~8.5% of the index. This areas showed a HUGE rebound over the last month, up 34% month over month (seasonally adjusted), though still down 40% from the same period last year.


Source: METI.GO.JP

Friday, June 26, 2009

EconomPics of the Week (6/26/09)

Busy week, but now it's time for some beverages... if you want to keep up with anything interesting I find over the weekend, check out EconomPic at www.twitter.com/EconomPic

Economic Data
Personal Income Saved by Unemployment Insurance
Historical Unemployment Insurance
Durable Goods Jump = Aircraft Spike
Durable Goods... Update
The Worrying I in C + I + G + NX
I'm Back... What I'd Miss

The Lost Decade
The Lost Decade (Equities)
The Lost Decade (Jobs)

Global
Global Unemployment to Rise to 1970's Levels
Record Deflation in Japan
Japan's Trade is Free.... It's Free Fallin
Japan Bottoming?
Euro-Zone New Orders Plunge

Asset Classes
World Growth Projections Moved Markets? Nope
Corporate Bonds Roaring Back
Commercial Paper Market is Dying
Want to Sell Your Home.... Reduce the Price
California Muni Struggles Continue
CRE: TTTIIIIIMMMMMBBBEEEERRRR
Risk Asset Rebound... Then Why are Insiders Selling?

Random
Who Says You Can't Buy Happiness?

Historical Unemployment Insurance

I detailed this morning the increasing importance of unemployment insurance. But how does the current level compare to history?


The chart below details the dollar level of unemployment insurance as a percent of private wages.


We are now at a level not seen since the early 1980's and the speed at which this level is increasing doesn't seem to be slowing.

Source: BEA

Record Deflation in Japan

I wasn't going to report this as the theme is old news (i.e. deflation in Japan), but I noticed price declines were at record levels. Bloomberg reports:

Prices excluding fresh food slid 1.1 percent from a year earlier after dropping 0.1 percent in the preceding two months, the statistics bureau said today in Tokyo. It was the sharpest decrease since comparable figures were first compiled in 1971.

Bank of Japan Governor Masaaki Shirakawa said last week that price declines will accelerate through the middle of the fiscal year as demand slackens and crude oil continues to trade lower than last year’s record. Retailers including Aeon Co. are cutting prices to attract customers as falling wages and the worsening job outlook damp spending.


Source: Stat.Go.JP

Personal Income Saved by Unemployment Insurance

WSJ reports:

The income of Americans soared in May because of the government's economic stimulus, leading them to increase spending modestly and boost the saving rate to the highest in 15 years.

Personal income rose at a seasonally adjusted rate of 1.4% compared to the month before, the Commerce Department said Friday. The jump reflected reduced taxes and increased social benefit payments unleashed by the stimulus package.

Up? Yes. Soared? No. Looking at year over year figures, personal income continues to show anemic (or in disposable personal income terms negative) growth.


Was stimulus the savior? Well, if you classify unemployment (and the extension of these benefits), then yes. The amount of unemployment benefits paid out has doubled in the past 12 months.


The chart below shows this more clearly. While personal income has stabilized, it has been due to unemployment benefits making up the shortfall in compensation.


They key is what happens now. Unless benefits are extended again (and soon), these figures will turn negative unless you believe the broader economy picks up. There already have been negative signs as the exhaustion rate (i.e. those no longer able to collect benefits) has increased in recent months.

Source: BEA

Corporate Bonds Roaring Back


Source: Barclays

Thursday, June 25, 2009

Commercial Paper Market is Dying

Peter Boockvar (Managing Director of Miller Tabak + Co.) via The Big Picture:

Commercial paper outstanding for the week fell by a sharp $47.5b and totals $1.15 trillion, the lowest since at least Nov ‘00 that data is out and down from the record high of $2.22 trillion in July ‘07. The decline was led by a $44.3b decline in nonfinancial CP to $108.7b, a 29% drop from the prior week, by far the biggest drop since ‘00.

While the decline reflects in part the sluggish economy as short term funding needs continue to shrink due to the lack of compelling investment opportunities, there has been a continual push on the part of corporate CFO’s of industrial co’s to push out the term of funding and thus be less subject to the vagaries of the short term CP market.


Source: Federal Reserve

The Worrying I in C + I + G + NX

The final figures for Q1 GDP were released this morning and although nothing drastically changed (revised up to -5.5% from -5.7%), the figures for non-residential investment are still important to review.

Investment is important to long-term economic growth and/or recovery. One such study by Brad De Long and Larry Summers on the relationship between equipment investment and economic growth noted:

We find that producers’ machinery and equipment has a very strong association with growth: in our cross section of nations each percent of GDP invested in equipment raises GDP growth rate by 1/3 of a percentage point per year. This is a much stronger association than can be found between any of the other components.
For that reason, a massive drop in investment is not only cause for concern now, but for future and lasting economic growth. And the size of the drop in investment is massive.


Source: BEA

The Lost Decade... Part II

Earlier this week we took a look at the Lost Decade for the S&P 500. Business Week provides another lost decade... jobs (EconomPic detailed this trend at a higher level earlier this month):

Between May 1999 and May 2009, employment in the private sector sector only rose by 1.1%, by far the lowest 10-year increase in the post-depression period.

It’s impossible to overstate how bad this is. Basically speaking, the private sector job machine has almost completely stalled over the past ten years.
The chart below shows the number of jobs added / subtracted by sector.


Health care, education, and government sectors added a total of ~7mm jobs over the past 10 years. Everything else? A drop of almost $4mm.

Source: Business Week

Euro-Zone New Orders Plunge

Guardian reports:

Euro zone industrial orders plunged by more than a third year-on-year in April, a record decline led by capital and intermediate goods that pointed to continued contraction of the economy, data showed on Thursday.

Orders fell 1.0 percent month-on-month for a 35.5 percent annual drop, European Union statistics office Eurostat said. Economists polled by Reuters had expected a flat monthly reading and a 32.3 percent year-on-year fall.

"If you play the 'green shoot' game, it is better to avoid the hard data," said Martin van Vliet, economist at ING.


Source: Eurostat

Wednesday, June 24, 2009

Durable Goods... Update

Here's an update to my post on today's durable goods, which puts the "spike" (in aircraft) in perspective (i.e. there was no real spike).


What there does appear to be is a bottom (temporary or permanent TBD) in the speed at which the level of new orders are deteriorating (dblwyo- the 2nd derivative is positive after all!).


Source: Census

Durable Goods Jump = Aircraft Spike

As I mentioned via Twitter, Durable Goods jumped unexpectedly due to aircraft orders. The WSJ with the details:

Manufacturers' orders for durable goods increased by 1.8% last month to a seasonally adjusted $163.92 billion, the Commerce Department said Wednesday.

Wall Street expected a big decrease. Economists surveyed by Dow Jones Newswires had projected orders in May would fall 0.8%.


Durable goods less aircraft was flat to April, still above expectations.

Source: Census

Global Unemployment to Rise to 1970's Levels

OECD details:

More than 57 million people will be unemployed in OECD countries by the end of 2010, according to OECD estimates, up from 37.2 million at the end of 2008, when the average unemployment rate was 6.8%. The expected increase will bring OECD-wide unemployment to 9.9% at the end of 2010, its highest level since the 1970s, with an average for the year of 9.8%. Unemployment touched a recent low point of 5.5% in the last quarter of 2007, standing at 31.6 million at the end of that year.
Here is a chart using data by the OECD for job losses in a number of countries over the past 16 months....


Not pretty as of April, but it is expected to get worse. Does anyone still think this will be a recession like the early 90's?

Source: OECD

Who Says You Can't Buy Happiness?

ABC News reports:

Americans' ratings of their personal finances have tumbled in the last six weeks to their lowest in 23 years of weekly polls, pushing overall consumer confidence to within a point of its worst ever.

Just 39 percent of Americans in this week's ABC News Consumer Comfort Index rate their own finances positively, down 13 points in six weeks – the biggest such drop on record – as spiking gas prices have added insult to recessionary injury.
Actual... maybe you can't buy happiness, but it sure looks like you can buy "less misery".


Source: ABC

Tuesday, June 23, 2009

Japan's Trade is Free.... It's Free Fallin

Bloomberg reports:

Japan’s export slump accelerated in May, casting doubt on the economy’s growth prospects as it struggles to emerge from the worst postwar recession.

Shipments abroad dropped 40.9 percent from a year earlier, more than April’s 39.1 percent decline, the Finance Ministry said today in Tokyo. The median estimate of economists surveyed was for a 39.3 percent decrease. From a month earlier, exports fell 0.3 percent, the first deterioration since February.

Declines in shipments to Asia deepened for the first time since January, damping hopes that demand from the region will spur a recovery in the world’s second-largest economy. China’s 4 trillion yuan ($585 billion) in stimulus measures haven’t been enough to offset sales declines in the U.S. and Europe.
China isn't offsetting anything. Yes, trade with China has dropped less than with most other trade partners, but it is still off a whopping 30% year over year.


Source: Customs.Go.JP

The Lost Decade

BusinessWeek reports:

There are still six months left in this decade, but it is not too soon to start drafting its obituary. Howard Silverblatt, senior index analyst at Standard & Poor’s, is already looking at the decade’s stock market legacy. It’s ugly. The S&P 500 is down 39.22% from Dec. 31, 1999 through Monday’s close.

“We need a 63.79% advance just to break-even for the decade,” Silverblatt says. That’s not going to happen by Dec. 31. “The last negative decade was the 1930s, -41.77%,” according to Silverblatt. Annualized, stocks lost 5.12% so far this decade; in the 1930s decade of the Great Depression they lost 5.26%.

Things actually aren't that bad, the S&P 500 is down "only" 28% through Monday for the decade (for some reason Business Week doesn't include dividends, which makes no sense),

Hey, look at the positive... including dividends, we only need a 39% return to break-even.

Want to Sell Your Home.... Reduce the Price

Marketwatch reports (bold mine):

Falling prices boosted sales of pre-owned homes in May to the highest level since October, the National Association of Realtors estimated Tuesday. Existing-home sales rose 2.4% to a seasonally adjusted annual rate of 4.77 million, the trade group said. Sales have risen in three of the past four months, and are down 3.6% in the past year. The sales increase was less than the 4.85 million rate expected by economists surveyed by MarketWatch. The median sales price fell 16.8% in the past year to $173,000 (worse than the 14.9% we saw last month, which was likely just noise), the third largest year-over-year decline on record. Inventories of unsold homes fell 3.5% to 3.80 million, representing a 9.6-month supply at the May sales pace.
The only region which has seen an increase in year over year sales is the West.


Why? As the chart below shows, the median price of a home in the west has dropped considerably in recent months vs. the national average.


Want to sell your home? Lower the price.

Source: Realtor.org

California Struggles Continue

Housing downturn in the epicenter of the subprime fiasco = high unemployment (per The Big Picture):

“California continues to bleed jobs, more so than most of the rest of the country. The national unemployment rate for May was 9.4%, and only four states had higher jobless numbers than California: Michigan at 14.1%, Oregon at 12.4% and Rhode Island and South Carolina, tied at 12.1%.
Housing downturn + high unemployment = loss of revenue for the state = massive budget deficit (per NY Times):
The state of California is facing a multi-notch downgrade of its debt if it fails to resolve its budget woes, Moody’s Investors Service said Friday.

The warning follows a similar one from Standard & Poor’s, which put the state on a negative credit watch earlier this week because of its dismal financial condition.

“If the legislature does not take action quickly, the state’s cash situation will deteriorate to the point where the controller will have to delay most non-priority payments in July,” Moody’s said. “Lack of action could result in a multi-notch downgrade.”
Threat of downgrade = widening spreads relative to the broader Muni index:


Widening spreads = feedback loop as higher interest payments means it costs more for California to finance their debt. So, is California toast? Still highly unlikely. DerivActiv (via The Bond Tangent)
There's still very low default risk in owning California bonds. California still has enormous amounts of structural protection for bond holders. But that being said, situations where the voters gave, depending on your interpretation, but a fairly clear message, I think, that tax increases are off the table. So it should have been able to reduce the polarization of that legislature and facilitate a quicker budget solution, but it just has not been the case. It's almost been the opposite. Now the legislature seems to not know what to do at all. The Governor has taken two-year cash flow borrowing off the table for this year, which means that really the focus has to be even more on cost cutting.
So enjoy that extra 50 bps of yield, but expect to pay for it in the form of volatility.

Source: Barclays

World Growth Projections Moved Markets? Nope

I hate that the media needs to explain EVERY market move. And yesterday's explanation was flat out ridiculous.

Bloomberg of all sources reported:

Stocks and commodities slid as the World Bank said unemployment and poverty will rise in developing nations and predicted a 2.9 percent contraction in the global economy this year. That compares with a prior estimate of a 1.7 percent decline. Growth is expected to return in 2010 at 2 percent, less than the 2.3 percent forecast about three months ago.
Here is the detail of the news that "moved the market" yesterday.


Cumulative forecasts for 2007-2011 is even more telling.


The World Bank's forecast is that the United States economy will grow a total of 4% over the five years, a level which would historical take a bit over a year. And that news IS ugly, but did it really move the markets yesterday?

As I pointed out on June 11th (yes, 11 days ago) via Twitter:
World Bank sees global economy contracting 3% in 2009 (double the level thought 2 months ago)
Can I see the future? Actually no... I can just read the NY Times from June 11th (again, 11 friggin' days before yesterday's sell-off).
Underscoring the risk that hopes for a quick turnaround anywhere may be premature, the World Bank said Thursday that it expected the global economy to shrink by nearly 3 percent in 2009, far deeper than the 1.7 percent contraction it predicted just over two months ago.
Why can't the media just admit that markets don't always (or usually) move due to specific daily events. Rather, the sell-off was likely just due to the fact that the equity markets have run up 40% in three months even though the economy is in serious trouble.

Source: World Bank

Monday, June 22, 2009

CRE: TTTIIIIIMMMMMBBBEEEERRRR

Zero Hedge with the details:

Moody's has released its April Moody's/REAL Commercial Property Price Indices (CPPI) update and it is a doozy: -8.6%, after what many had expected was a shooting green reading of just -1.7% in March. The problem that many don't grasp, that even Moody's has finally caught on, is that once capitulation in CRE sets in, the bottom will be torn out.

How low can we go?

Source: MIT

Risk Asset Rebound... Then Why are Insiders Selling

Business Day reports:

Sales by CEOs, directors and senior officers have accelerated to the highest level since June 2007, two months before credit markets froze, as the S&P 500 rebounded from its 12-year low in March. The increase is making investors more skittish because executives presumably have the best information about their companies' prospects.
This follows a 40% jump in the stock market over the past ~3 months (apparently the fastest such rally in 71 years) . So why sell? To understand that lets put that rebound (and all other asset class returns since the last "selling period") in perspective.

The chart below shows the cumulative return of a number of assets class indices since that June 2007 date. While the overall trend was apparent pre-September Lehman collapse (i.e. the more leveraged the asset, the higher the sell-off), the massive divergence between risk asset returns becomes more apparent after that date. It is interesting how much those assets higher in the capital structure hurt (i.e. debt - both investment grade and high yield) have rebounded after forced selling by investors at that time (the returns now actually make sense).


So equities still have a way to go before the are fully recovered and the recent rebound reflects the appearance of a stronger economy you say? Well, take a look at the chart below showing the returns of those same asset classes in the September - February period (i.e. the world is ending period) and the time since. It makes the record rally appear to be nothing more than a partial rebound.


Thus, the question remains... is the rebound really justified for ALL risk assets? If you are to believe insiders, the answer is a resounding no.

Source: Barclays

Japan Bottoming?

According to Daily FX, Japan's tertiary index:

Evaluates the monthly change in output produced by Japan's service sector. Japan's economy is very export based, because this report excludes manufacturing and only measures service industries catering mainly to domestic needs, the Tertiary Industry Index is a key indicator of domestic activity.
With that in mind, looking over the year to year April figures we see the massive collapse.


Now the good news... April showed a strong rebound in a number of areas, including information and wholesale / retail trade.


According to a Bloomberg piece:
“It’s becoming clearer that the economy has already hit bottom,” said Junko Nishioka, chief Japan economist at RBS Securities Japan Ltd. in Tokyo. “But the rebound will probably be lackluster in the absence of a solid recovery in profits, capital spending and consumption.”
Though yet again, we need to put this all in perspective:
Governor Shirakawa said last week that he’s “cautious” about the economic outlook because the pickup in demand may be temporary. Exports and production, while improving on a month- on-month basis, are about a third lower than last year’s levels.
Source: Meti

I'm Back... What I'd Miss

Got to love technology...

First what I didn't miss... with only around 30 minutes of I-Phone browsing per day over the past 2+ weeks, I was able to keep in touch with daily events and even post / comment on them via the social-networking site formally known to me as "stupid / waste of time / I don't get it" and now known as Twitter (I'm saving the phrase "pretty f'n cool" once I truly understand all its uses).

Not only did it provide a way for me to waste time posting daily economic / financial / interesting articles (i.e. my version of links of the day), but it allowed me to waste time reading about other economic / financial / interesting articles AND world events (i.e. the gripping situation in Iran) in real time. For those interested I will continue to post links to items I don't feel like using a full post on at www.twitter.com/EconomPic (you will also be able to view the most recent 7 twitter posts (I still don't like the term "tweets") on the upper right portion of the home page.

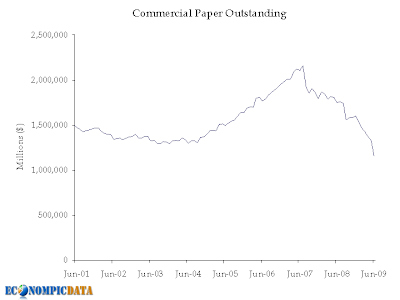
So, what did I sort of, but not fully, miss? Below is a chart of the changes in a few major asset classes (stocks, bonds, commodities) and well as the percent change in the 10 year yield (yes, a percent of a percent).


Sticking out like a sore thumb was the continued sell-off of in longer dated Treasuries. One of the main reasons (along with inflation expectations / less recycled dollars from a decreased current account deficit) is this week's massive issuance. Interest Rate Roundup with the details:

The Treasury Department just announced how much debt it's going to sell next week. Get a load of these figures: $61 billion in T-bills. $40 billion of 2-year T-notes. $37 billion of 5-year Notes. And $27 billion of 7-year notes. That's good for a record $165 billion of debt, the most sold in any week ever, driven by increased sales of five-year and seven-year debt. Long bond futures are off about 1 23/32 right now, with 10-year note yields up 11 basis points to 3.8%.
My personal view is that this may actually present a buying opportunity (what you talkin' about Willis?). In an environment that has continued to deteriorate (i.e. less worse isn't better, though the improvement in continuing claims was striking), you can currently collect a close to 4% REAL coupon (i.e. inflation is currently non-existent and the likelihood of inflation over the medium term is in my mind decreasing, though market expectations certainly disagree).

Why decreasing? Well, along with limited / no opportunity for workers to demand increased wages, take a look at the chart below using data from the Federal Reserve detailing the difference between current capacity and average capacity from 1972-2008.


What this shows is that there is massive excess capacity to manufacture goods (durable and non-durable) ready to meet any increase in end-user demand. This means the marginal cost to produce an additional good is minimal. Thus, unless demand increases dramatically in the short-run, inflation should be in check (all else equal).

As an aside, Paul Krugman detailed in a recent lecture (here) that this also poses is a problem to the recovery story. One of the automatic stabilizers in an economy is that at some point new investment is needed (either to replace old capital stock or because new technology is that much better). In this cycle, there is MASSIVE amounts of excess capacity that needs to be filled before any new investment will be put in place (i.e. for the new factory or equipment).

While I do believe in the inflation story over the long term (my view is a lot of this excess capacity will fall at some point in the future, not due to increased demand, but due to decrease in supply with companies going out of business), investors in general use very short-term information and have a VERY short memory. If we see continued negative PPI and CPI prints over the next 3-6 months, I think there is a strong possibility that the inflation story will become the deflation story. In addition, if equity markets lose even a portion of the massive gains (is half the rebound of out the question?) they've seen over the past 3 months, expect investors to once again flock to the "safety" of Treasuries.

Thursday, June 4, 2009

See You in Two Weeks (or on Twitter?)

I will be traveling the world over the next two weeks with limited access to the Internet (actually that is not true, just not bringing a laptop). What will you all do without me? Actually, here are a few options...

1) EconomTwit? Not exactly (I'll stay with EconomPic, though it will be curious to see how my thoughts come across in 140 characters vs. 1 chart). Warning: at this stage I have no idea what I am doing with Twitter... but if I come across anything interesting, I will try my best to share through my Twitter profile starting next week (http://twitter.com/EconomPic; you can join the whopping 14 people that currently follow me there).

2) Post yourselves! I learn more from you than you from I. Lets build on that. Use the comments section of this specific post to share interesting economic / market / security specific / political items you come across. Either in words and/or add a link. How to link in Blogger comments you ask (the full links often get cut off)?

Hyperlink: How? Go here to learn the simple code

TinyUrl: Use TinyUrl to create a shortened link

See you all in a few weeks...

This weeks mini EconomPics of the Week

Economic Data
ADP: Small / Mid-Size Companies are Bulk of Employ...
ISM Manufacturing
Non-Manufacturing Continues Slide
The "Miracle" Down Under
Personal Consumption Declining for Durables and Non-Durables
Service vs. Manufacturing
GDP Revision Breakout
Construction Spending on the Rise

Assets / Markets
Oil: Supply Up, Demand Down
"Mortimer We're Back" Corporate Bond Edition
U.S. Autos Rebound: Too Little, Too Late Edition
Pending Home Sales Shows Stabilization

Wednesday, June 3, 2009

Euro Deflation

Missed this in the A.M. Marketwatch reports:

Producer prices in the 16-nation euro zone saw a monthly fall of 1% in April, taking prices 4.6% below the level seen in the same month last year, the statistics agency Eurostat reported Wednesday. Economists had forecast a 0.9% monthly fall and a 4.5% decline from a year ago. News reports said the annual fall was the largest on record. Eurostat also reported a 2.5% quarterly contraction in first-quarter euro-zone gross domestic product, unchanged from a preliminary estimate released last month.


Source: Eurostat

Oil: Supply Up, Demand Down

And why are people bullish on oil? If your answer is the dollar, then short the dollar.

Supply

CNN Money:

Oil prices extended their decline Wednesday after a weekly government inventory report said crude supplies rose unexpectedly. Light, sweet crude for July delivery fell $1.37 to $67.18 a barrel by 10:48 a.m. ET. Oil had traded down 75 cents just prior to the report's release.

In its weekly inventory report, the Energy Information Administration said crude stocks increased by 2.9 million barrels in the week ended May 29. Analysts expected oil supply to decrease by 2 million barrels, according to a consensus estimate of industry analysts surveyed by Platts, a global energy information provider.


Demand

Bloomberg:

U.S. fuel demand fell 900,000 barrels to 17.7 million barrels a day last week, the biggest decrease since the week ended Jan. 9, the report showed. Gasoline consumption slipped 518,000 barrels to 9.02 million.

The peak U.S. gasoline demand period lasts from late May’s Memorial Day holiday until Labor Day in early September, as Americans take to the highways for vacations.

It was surprising to see gasoline demand drop, because of the Memorial Day holiday,” said Mike Zarembski, senior commodity analyst at OptionsXpress Holdings Inc. in Chicago. “It’s probably a sign that consumers are cutting back on driving because of the run-up in retail prices.”

Source: EIA

ADP: Small / Mid-Size Companies are Bulk of Employment Loss

Marketwire reports:

"May's ADP Report estimates nonfarm private employment in the service-providing sector fell by 265,000. Employment in the goods-producing sector declined 267,000, with employment in the manufacturing sector dropping 149,000, its thirty-ninth consecutive monthly decline."

"Large businesses, defined as those with 500 or more workers, saw employment decline by 100,000, while medium-size businesses with between 50 and 499 workers declined 223,000. Employment among small-size businesses, defined as those with fewer than 50 workers, declined 209,000," said Prakken.


Source: ADP

Non-Manufacturing Continues Slide

Marketwatch reports:

Business worsened in May in the nonmanufacturing sectors of the U.S. economy for the eighth consecutive month, according to the Institute for Supply Management. The ISM nonmanufacturing index rose to 44% from 43.7% in April. Economists were expecting an increase to 46%. Readings under 50% indicate that most firms say business conditions worsened in May compared with April. The new orders index fell to 44.4% from 47%.

Source: ISM

"Mortimer We're Back" Corporate Bond Edition

Well almost back. WSJ with the details:

Nine months later, investment grade corporate bonds have recovered from the shock of Lehman Brothers’ implosion. Investment grade spreads, or the premium demanded over Treasurys of a similar maturity, dropped to 371 basis points Tuesday, according to Merrill Lynch. They hadn’t been that inexpensive since September 15, the first day of trading after Lehman Brothers Holdings Inc. filed for bankruptcy.

Spreads had taken quite the ride since spiking at the end of 2008. They soared as high as Spreads soared as high as 656 basis points December 5 before returning 100 basis points. They briefly rallied to 600 basis points in late March and then plummeted in recent weeks. A basis point is 0.01 percentage points.


Source: BarCap

Tuesday, June 2, 2009

The "Miracle" Down Under

WSJ reports:

Australia's A$1.1 trillion economy grew in the first quarter of 2009, defying a capitulation in global trade and crunched confidence, and for now sidestepping a technical recession.

Australia's economic slowdown so far appears mild compared with other developed economies but any jubilation is set to be brief as Australia's quarter of growth hinged almost entirely on a positive shift in the country's trade accounts, offsetting a massive slump in business investment and profits, with a terms of trade plunge set to weigh heavily on the economy through 2009.

The average measure of gross domestic product rose 0.4% in the first quarter of 2009 from the fourth quarter of 2008 and rose 0.4% from a year earlier, the Australian Bureau of Statistics said Wednesday.


Source: ABS.GOV.AU

U.S. Autos Rebound: Too Little, Too Late Edition

Auto Blogger with the details:

We weren't expecting this, especially from General Motors, which was forced to sell cars and trucks last month amidst rumors of impending bankruptcy (something that came to fruition as soon as the month was over). Despite this, GM posted a decrease in sales volume of only 29.55%. Sure, GM's sales decreased last month compared to May 2008, but they decreased at a far slower rate than its major Japanese competitors: Toyota (-40.72%), Honda (-41.46%) and Nissan (-33.10%). Plus, check out the chart below and you'll notice that GM's top four performing brands – Chevy (-23.74%), Cadillac (-39.86%), GMC (-22.13%) and Buick (-16.98%) – are the same ones that will be transferred over to New GM after it emerges from bankruptcy, which is certainly a good sign.
April YoY vs. May YoY


Variance Between the Two