Justification for the below?
- Risk on / reflation in the developed world (continued dollar sell-off)
- Brakes thrown on in emerging market world
- Sell-off in rates across the board
- Gold and oil off because... who knows

Source: Google Finance

Justification for the below?
Bloomberg detailed:
Businesses in the U.S. expanded in January at the fastest pace since July 1988, indicating the world’s largest economy has momentum at the start of the year.
The Institute for Supply Management-Chicago Inc. said today its business barometer rose this month to 68.8 from 66.8 in December. Figures greater than 50 signal expansion, and economists projected the gauge would slip to 64.5, based on the median estimate in a Bloomberg survey.

Pretty wild release. HUGE positive impact (more than 3%) by improvement in net exports. HUGE positive impact (more than 3%) by consumption (strong demand in durable and non-durable goods). HUGE negative impact (almost 4%) by inventory liquidation to meet final demand vs. new production.
Random? Yes, but I like dogs...
The American Kennel Club (hat tip Skip) details:
This year’s list included some shakeups in the top 10 – the Beagle overtook the Golden Retriever for the 4th spot and the Bulldog, who has been steadily rising up in rank, took 6th place away from the Boxer, who dropped to 7th in 2010.
"Not since the early 20th Century has the Bulldog enjoyed such sustained popularity," said AKC Spokesperson Lisa Peterson. "‘Bob’ was the first AKC registered Bulldog in 1886, and today the breed enjoys its highest ranking in 100 years at number 6."

The Huffington Post details the top 11 cash hoarders.
Below is a chart of the cash levels for 10 of the 11 (I excluded GM as they don't have 12 month's of positive earnings), the earnings yield of each company (defined as the inverse of the P/E ratio), and the adjusted earnings yield that backs out the cash from the corporation's market value to determine the earnings power of the company less cash (normally you would have to account some earnings to the cash, but in the current environment, that is minimal).Instead of building plants or hiring workers, corporate America is clinging to its cash.Companies are sitting on $1.93 trillion in cash and liquid assets, the highest level since 1959, the Wall Street Journal reports.
With high unemployment and families still limiting their spending, corporate America is backing away from expansion. But with interest rates on the heaps of cash so low, that $1.3 trillion might as well be stuffed in a mattress.

Professor Damodaran (via World Beta and Abnormal Returns):
S&P's most recent update indicates that US companies, after a pause for about a year after the banking crisis, are back in the buyback game. In the third quarter of 2010, the S&P 500 companies bought back almost $ 80 billion of stock, up 128% from the third quarter of 2009.The below chart shows the dividend yield (dividends divided by the S&P 500's market cap) and buyback yield (buybacks divided by the S&P 500's market cap) on a quarterly basis (annualized) going back to 2004.

Marktetwatch details:
An index of U.S. consumer confidence jumped to 60.6 in January, reaching the highest level since May, with more consumers optimistic about income and jobs, as well as current business conditions, the Conference Board reported Tuesday.Note that this does not mean consumers are confident, just that their confidence has improved. Taking a look at the details behind the index we see an improvement across the board, but from very low levels.

RTT News details:
Eurozone industrial new order growth quickened in November, led by Portugal, Finland and Germany, official figures showed Monday. Industrial orders rose 2.1% month-on-month in November, after rising 1.4% in October, the European Union Statistical office Eurostat said. On an annual basis, industrial order growth accelerated to 19.9% from 14.8% recorded in the preceding month. The rise exceeded the 17.5% increase economists had forecast.The below charts show that much of this is purely a rebound off lows, with a relatively strong relationship between those reporting strong results in 2010 off of lower figures in 2009.


FT Alphaville reports (via Bullion Vault dealers):
Looking at China’s latest import data, 2010 saw silver imports (net of exports) rise four-fold from 2009 note analysts at Mitsui in London – a total of 3,500 tonnes.
A heavy seller of silver bullion after lifting the state’s 50-year monopoly in 2000, China was a net export of 3,000 tonnes as recently as 2005.

Bloomberg details:
The index of U.S. leading economic indicators increased in December more than forecast, a sign the recovery will gather steam in the new year.And the biggest driver of that growth...
The Conference Board’s gauge of the outlook for the next three to six months rose 1.0 percent after a 1.1 percent gain in November, the New York-based group said today. The December reading, the sixth consecutive monthly increase, exceeded the 0.6 percent gain in the median forecast of economists surveyed.

Floyd Norris (via The Big Picture):
Consider the performance of the Standard & Poor’s 500 in 1969, the year the Jets won their only Super Bowl. It was down 11.4 percent.
Contrast that to the market’s performance after victories by any of the other teams still in contention. The market has never gone down after any of them won the Super Bowl.

Housing market optimists will blame this partially on December weather. Broader optimists will point out that low levels of new construction will help clear the existing inventory. Those looking for the housing market to contribute towards the economic recovery (outside of addition by the elimination of subtraction) will be disappointed.
Back in February of last year I detailed that China was NOT selling Treasuries when the "experts" in the media said they were. TIC December 2009 data initially stated Chinese holdings totalled a bit more than $700 billion, down from summer '09 levels. I made the case that these purchases were actually being made through the United Kingdom (more here). They were. The result is that China's December 2009 holdings were revised upward by $200 billion.
"Experts" in the media would have learned their lesson by now right?
To the Financial Times:
The FT was joined by the WSJ, CNN, and Marketwatch amongst others getting it wrong. Bloomberg got it right here, but wrong here.China and Russia were the major sellers of US Treasuries in November as bond yields surged sharply higher that month, according to the latest government data.
The US Treasury reported on Tuesday that private investors sought more dollar-denominated stocks and bonds in November than October, offsetting record sales by foreign governments.

Will this be enough for them to spend some of that cash hoard?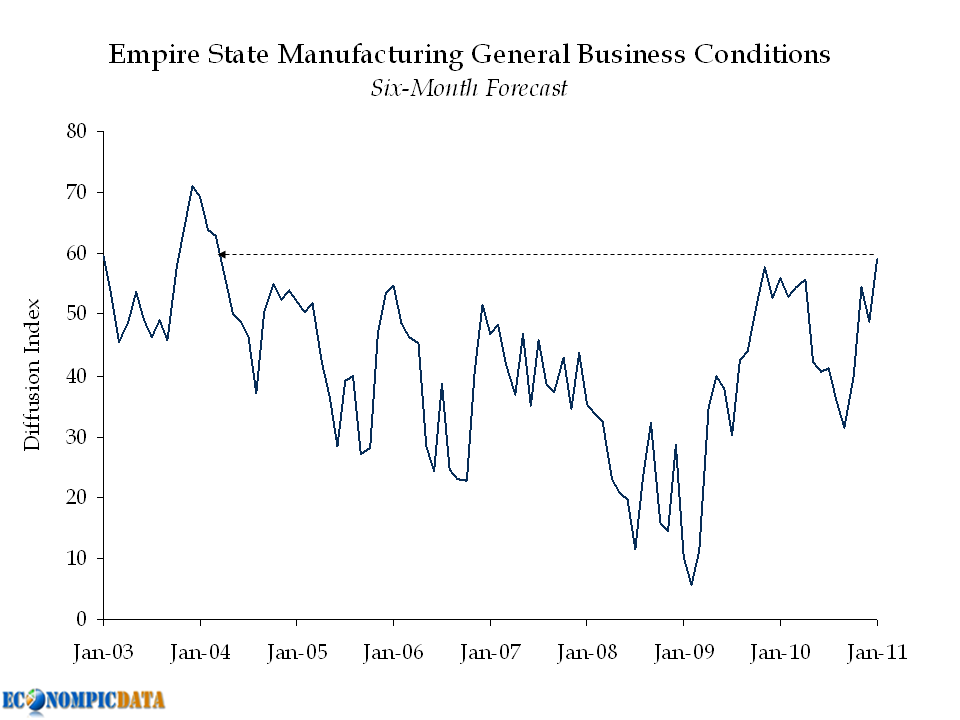
The below chart shows that capacity utilization in the system is slowly recovering, but remains remain very low.
This in part explains why core inflation remains muted, even with the recent commodity spike.
Source: Federal Reserve / BLS
This be called EconomPics of the year to date, but doesn't sound as good.
Assets / Financial Markets
China Owns Lots of Paper
A Strong 2010 for Hedge Funds
The History of Corporate Bonds
Trading Day #1 of 2011 = Risk On
Realized 20-Day Vol at 39 Year Low
Debt
The Federal Debt Spike
More on the Federal Debt
An Even Uglier Federal Debt Chart
Economic Data
Mind the Gap
PPI Hits Four-Handle
Employment Picture: Getting There... VERY Slowly
Employment Higher, but Disappoints
An Employment Report We've Been Waiting For
ISM Services Strong in December
Other
The iPhone was a Huge Success...
Bernanke: 2010 Fund Manager of the Year
And your video of the week... Black Keys with Tighten Up. And you thought Ohio was worthless.
for even more "on the street" bang, i'd plot this as a function of percent employed (non-public sector..as the gov't really doesn't produce anything).

Bloomberg details:
Wholesale costs in the U.S. rose in December by the most in 11 months, led by higher prices for commodities such as fuel and food. The producer price index increased 1.1 percent from November, Labor Department figures showed today in Washington. Economists projected a 0.8 percent gain for a second month, according to the median forecast in a Bloomberg News survey. The so-called core measure, which excludes volatile food and energy costs, climbed 0.2 percent, in line with estimates.Year over year headline PPI hit 4%, but the rise does remain contained in raw material costs.

The iPhone is coming to Verizon! The iPhone is coming to Verizon! iPhone users sick of AT&T (i.e. me) have rejoiced. Should stock holders rejoice as well?
Lets rewind and see just how much AT&T has outperformed since that launch. To Wikipedia:
The first iPhone was introduced on January 9, 2007.Since that time (including dividends)...

In response to my post on the Federal Debt Spike, reader Todd commented:
Would like to see this in real terms or as a percent of gdp. I bet the exponential increase would be even more pronounced.

Morgan Stanley (via Self Evident)
A statutory limit on the amount of federal debt outstanding has been in place since 1917, when Congress enacted the Second Liberty Bond Act. The current limit is $14.294 trillion. Since 1940, the debt ceiling has been increased on 80 separate occasions.Current levels are now north of $14 trillion, bringing increase #81 shortly.

Bloomberg details:
Job openings in the U.S. fell in November from the highest level in two years, signaling a sustained labor market recovery will take time to develop.
The number of positions waiting to be filled decreased by 80,000 to 3.25 million, the Labor Department said today in Washington. The number of people hired dropped from the prior month and separations climbed.
The drop in job openings was led by education and health- service providers, which saw a 91,000 decrease in openings. Retailers had 37,000 fewer jobs available and state and local government agencies saw a 25,000 decrease. Professional and business services, which include accountants, computer systems experts and temporary-help agencies, had the biggest increases in available employment, followed by manufacturers.
Compared with the 15 million Americans who were unemployed in November, today’s figures indicate there were 4.6 people vying for every opening, up from about 1.8 when the recession began in December 2007. The number of jobless fell to 14.5 million last month, pushing the unemployment rate down to 9.4 percent, the lowest since May 2009, the Labor Department reported last week.Source: BLS
Bloomberg details:
China’s foreign-exchange reserves climbed 18.7 percent to a world-record $2.85 trillion at the end of 2010 from a year earlier and domestic lending exceeded the government’s full-year target. The currency holdings, reported by the central bank on its website today, were bigger than the $2.76 trillion median estimate in a Bloomberg News survey of nine economists.How fast have reserves been built? 26.4% annualized since 1978 (reserves crossed $2 trillion in 2009 and $1 trillion in 2006).

Back in November I posted that the Fed is Literally and Figuratively "Printing Money". That turns out to be an understatement. The Federal Reserve details:
The Federal Reserve Board on Monday announced preliminary unaudited results indicating that the Reserve Banks provided for payments of approximately $78.4 billion of their estimated 2010 net income of $80.9 billion to the U.S. Treasury. This represents a $31.0 billion increase in payments to the U.S. Treasury over 2009 ($47.4 billion of $53.4 billion of net income). The increase was due primarily to increased interest income earned on securities holdings during 2010.

At the end of 2010, the Federal Reserve system had $2.423 trillion in assets and $2.367 trillion in liabilities, which means that the simplest measure of its total equity — assets minus liabilities — comes to $56.6 billion. The Fed also managed to earn net income of $80.9 billion in 2010. Which means that its return on assets was incredibly high at 3.3%, while its return on equity was an astonishing 143%.
Strong performance across hedge fund styles in 2010.
Note that this was a year when most asset classes had strong years, including equities (S&P 500 was up ~15%), fixed income (the BarCap Agg was up ~6.5%), and commodities (DJUBS Commodity index was up ~17%).
Source: Barclay Hedge
Overall, this has to be labeled a disappointment following this week's ADP payroll release. It is interesting to note that the household survey was much stronger than the ~100k jobs shown in the non-farm payroll survey (and mirrored the ADP figure). Optimists out there can hope that individuals are finding work in areas not covered by the latter survey (though if you believe that, then why did 400k people drop out of the workforce?).

Strong ISM results, but interesting in that it doesn't point to a follow through on this morning's great ADP services employment jump. ISM detailed:

Private sector payrolls soared 297,000 in December, payroll processor ADP announced Wednesday.
The gain marks the 11th consecutive month of increases, and was much larger than economists had expected. Economists surveyed by Briefing.com were forecasting an increase of 100,000 jobs.
The increase in hiring was led by the services sector, with employers adding 270,000 jobs in December. That's the highest jump on record, ADP said.

Vix and More details:
Since I haven’t seen it mentioned anywhere else, I thought I should note that 20-day historically volatility in the S&P 500 index hit its lowest level since April 1971, the same month that the Rolling Stones released Sticky Fingers and Charles Manson was sentenced to death.


