Monday, September 28, 2015

Using the VIX Futures Term Structure to Reduce Equity Exposure

The WSJ blog had a recent article The VIX Market Suggests It’s Not Yet Time to Buy the Dips outlining:

Typically, longer-dated VIX futures are more expensive than VIX futures expiring in the current month, as there’s a greater chance of stock swings over a longer time period. That makes for an upward sloping futures curve.
In times of stress, when investors are very fearful about the stock market over the next few weeks, they bid up the prices of short-dated futures more than the prices of the longer-dated futures. That phenomenon is known as “backwardation,” meaning a downward sloping futures curve. 
The article itself pointed to the relatively flat term structure (as of Friday), stating that an elevated VIX for the foreseeable future is a potential outcome. I've written in multiple iterations (here and here are two examples), that the VIX does a great job of predicting future levels of volatility AND risk-adjusted returns. What I'll take a look at now is whether the term structure adds additional insight (sneak peak... it just might).


The VIX Term Structure

I went into greater detail in a recent post about the VIX term structure (that was specific to trading VIX futures), where I introduced the VIX/VXV ratio (i.e. the Implied Volatility Term Structure or "IVTS"):
One way to make an allocation is to simply allocate to a long VIX futures position only when they have a tailwind vs. headwind. Simply calculate the term premium (a simple way is to use the VIX/VXV ratio - details of what that is by the great Bill Luby here) to determine contango or backwardation (in this case when the VIX/VXV is less than or greater than 100) and only allocate to UVXY when it's above 100. To put some numbers behind that statement, the average modeled daily performance of UVXY is -1.1% when the ratio is < 100 (2500 trading days) and 5.0% when the ratio > 100 (378 trading days) since 2004.
So... in addition to simply looking at the level of the VIX (in this case whether the VIX is greater than 20), we also look at the levels of the IVTS (in this case if it's greater than 100).

The table below outlines the results of next day S&P 500 returns given the level and term structure of the VIX.


Some highlights... the geometric returns are broadly the same whether the VIX is above or below 20, but the volatility is MUCH lower at low levels of VIX (resulting in higher levels of risk-adjusted returns at low levels of the VIX). However, the addition of the IVTS signal shows a lot of interesting promise. 

When both signs are in disagreement, returns are by far the best, with returns of  11.9% when the VIX > 20, but the IVTS < 100 and a whopping 105% when the VIX < 20 and the IVTS > 100. When both signals are telling investors to tread carefully (i.e. VIX > 20 and IVTS > 100),  returns have been abysmal, with returns of -8.6% and volatility north of 40%.


Data Mined Model

Using the above insight to create a model that is absolutely data mined (yet may be interesting to look at going forward), we use the following rules:
  • If VIX > 20 and IVTS > 100, go to aggregate bonds
  • Otherwise, S&P 500

Something to keep an eye on as the warning signs are both currently flashing red.

Monday, September 21, 2015

Momentum Applied to Mutual Funds

Back in May, I posted A Guide to Creating Your Own Hedge Fund outlining how the application of momentum to the two worst performing funds within the Morningstar Multialternative category over the previous ten years would have provided an investor with better risk-adjusted returns than the Barclays Hedge Fund index and a lower correlation to equity markets.

Now, I'll share how a similar strategy going back a further ten years would have performed using randomly selected funds from the Morningstar Moderate Allocation / World stock universes. As an aside... this isn't too far removed from how I manage my own retirement money.


Narrowing the Universe for a Few Examples
  • Use the oldest share class within the Morningstar Moderate Allocation or World stock universe (oldest share classes typically have a relatively high fee structure - so I'll deem this conservative)
  • Only funds with a track record going back 20 years, the result of which is 69 funds in the Moderate Allocation universe and 44 funds in the World stock universe (this unfortunately adds to the survivorship bias, which makes the below figures a bit less conservative)
  • Randomly narrow the universe down to five funds; I used Excel's rand function for each iteration (this makes the results much more conservative in my view)

Allocation Rules

Random Momentum
  • If the 9-month return of the fund is > 0, allocate next month to the fund, otherwise to aggregate bonds
  • 20% weight to each fund's "path"
Dual Momentum (Top 3)
  • Pick five funds at random (as done with 'random momentum')
  • Take the best 3 performing funds over the previous 9-months and if > 0, allocate next month to the fund, otherwise to aggregate bonds
  • 1/3rd weight to top 3 at the previous month-end

Results

Moderate Allocation

The below are my first 5 results (random iterations of the 69 funds) vs. an equal weight of all 69 funds with a 20 year track record and the S&P 500.


And the same rules applied to the Morningstar World stock fund universe


The challenge (and likely reason why it works) are the extended periods of underperformance an investor using momentum must deal with relative to a long only stock portfolio (these strategies have all materially underperformed during strong bull markets). I''ll save what I view as a potential fix to that for another day. For now, buyer beware... as of 8/31/15, less than 10% of funds within the Moderate Allocation and World categories had positive returns over the previous 9-months.

Wednesday, September 9, 2015

The Case for Put Writing / Further Improving PutWrite Performance

What is Put Writing?

The CBOE has some great resources on what exactly put writing is here, but in a nutshell:

The CBOE S&P 500® PutWrite Index is a benchmark that measures the performance of a hypothetical portfolio that sells S&P 500® Index put options against collateralized cash reserves held in a money market account. 
What this means is that the index sells puts at a 100% notional value (i.e. there is no leverage). For those more familiar with covered call writing (i.e. writing calls on the stocks you own, which gives up a less certain upside for a more certain option premium), the chart below highlights that covered calls and put writing result in the exact same economic exposure (the green on the left and orange on the right are identical), which is downside risk commensurate to the stock's decline with upside capped at the premium collected (the below chart comparing the two ignores that premium).


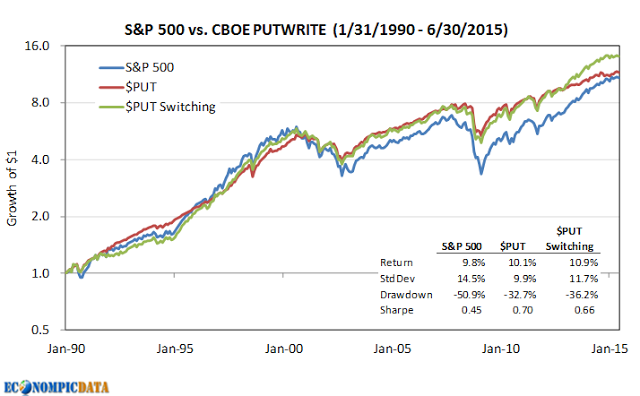
The historical benefit of put writing has been a long run return close to that of the S&P 500 index, with slight underperformance during bull markets and outperformance during bear markets. The PutWrite index can be thought of as an alternative means of capturing the same equity premium; through premium collection in the case of put writing (i.e. collecting the insurance that others are willing to pay to protect their portfolio) vs. the upside of the equity market.

Of note is the PutWrite index has historically achieved this similar performance with a lower risk profile than the S&P 500 (as defined by both standard deviation and drawdown), the reason being that an investor has the same downside risk (the market), but a PutWrite investor collects a higher level of income (the option premium) vs the lower dividend distributions and the option premium increases as market risk increases (while dividends can decrease), helping cushion losses further.


Improving Upon the Strategy Further - Switching Between Put Writing and the S&P 500

The great Philosophical Economics blog wrote a treatise outlining an improved way to manage put writing given that put writing generally underperforms the S&P 500 during bull markets and outperforms during bear market in part due to cushion the higher option premium provides put writing when market volatility picks up (i.e. insuring against a market downturn is more costly when investors view an increased probability of needing that insurance). As a result, an investor may be able to increase returns by allocating to PutWriting at month-end when the VIX is elevated (above 20) and to the S&P 500 at month-end when the VIX is more “normal” (less than 20).

The above rule does improve upon the strategy's absolute return (see "$PUT Switching" in the below chart). YET, that higher return comes at the cost of reduced risk-adjusted returns (higher standard deviation, higher drawdown, and a lower sharpe than the $PUT index itself).  


Another Alternative Utilizing a Surprising Characteristic of PutWrite Performance 

While I do think the above is an interesting solution, I think it misses one of the surprising characteristics of put writing... its risk-adjusted returns are actually higher when the VIX is lower. As the table outlines below, the absolute returns have indeed been lower when the VIX < 20 (9.2% vs. the 10.6% returns for the S&P 500), the sharpe ratio of the PutWrite index is a whopping 1.20 during these periods (a huge number for a 25 year time frame as any investor can attest). The reason being the level of VIX (or the amount of option premium received) matters less than the premium collected compared to the puts realized payout (i.e. what the insurance is actually paying out). In other words, it is more profitable to insure a good driver at a low insurance premium than a bad driver at a high premium.


As a result, rather than moving from put writing to the S&P 500 when the VIX is below 20 (a move that has resulted in higher returns, but lower risk-adjusted returns), simply increase your notional allocation to put writing when the volatility is low and decrease it when it is high. In the analysis below, my rules are as follows:

If the monthly close of the volatility index (VIX) is above 20, then for the next month invest in the put-write strategy at 67% notional (a 50% reduction) with the balance in 3-month t-bills. If the monthly close of the volatility index is below 20, then for the next month invest in the put-write strategy at 150% notional (a 50% increase) financed at the 3-month t-bill rate. 


The end result? Improved absolute return and material improvement in both standard deviation, drawdown, and sharpe ratio.

As an aside... put writing provides a ton of flexibility for an investor. Unlike covered calls, which requires collateral (the stocks you are writing calls against), put writing simply assumes you are holding 100% cash (t-bills). For those that are willing to be creative, there are a lot of interesting things you can do that can provide returns in excess of cash to further improve returns with limited increase in total risk.

Tuesday, September 1, 2015

Utilizing the Money Sucking $UVXY to Improve Risk-Adjusted Returns

Horrific Performance
An initial investment of more than $450,000 to the ProShares Ultra VIX Short-Term Futures ETN (UVXY) at the open of its October 4th, 2011 inception date (the split adjusted opening price) would be worth just $87 at today's close (this after a more than 28% gain today and more than 300% gain over the past few weeks). Modeling what the performance would have been going back to the inception of VIX futures in March 2004, a $100 million initial investment would be worth a bit less than $5 today (you read that correctly).


Investors Haven't Fared Better
Given the above performance figures, it should be no surprise that UVXY has eaten a tremendous amount of the capital investors have sunk into it. Since its launch, the ETN has seen net flows in excess of $1.7 billion, while current AUM stood at less than $400 million as of yesterday's close (simple math tells you investors have lost more than $1.3 billion in the strategy since inception). This figure may improve short-term, but I all-but-guarantee it will get worse over the longer term. As an aside... how in the world is UVXY accessible by mom and pop investors who have zero clue how it works.

What is It / Explaining the Underperformance
The ETNs description:
The Ultra Fund seeks daily results that match (before fees and expenses) two times (2x) the daily performance of the S&P 500 VIX Short-Term Futures Index. The index seeks to offer exposure to market volatility through publicly traded futures markets and is designed to measure the return from a rolling long position in the first and second month VIX futures contracts.
To summarize, the ETN provides exposure to a long position in the front two VIX futures contracts at 200% notional (i.e. it is a 2x levered position). If VIX futures simply followed the VIX, UVXY returns would be extremely mean-reverting as the VIX is one of them most mean-reverting figures in all of finance as it cannot go to zero or infinity. But, while VIX futures do typically move in sync with the VIX index over very short periods (i.e. the exposure most investors in UVXY believe they are getting), it does not over long periods of time.

The issue with VIX futures is the term structure, which during calm markets is typically in contango (i.e. VIX futures are priced higher than spot), while during distressed markets is typically in backwardation (i.e. VIX futures are priced lower than spot). UVXY benefits immensely from backwardation because the upward slope of VIX futures owned provides a tailwind to the futures contracts as they approach maturity (while UVXY faces a severe headwind during contango... which is present much more often).

Examples of VIX futures in contango (bad for UVXY) and backwardation (good for UVXY) is shown in the two below charts using data / charting from the especially helpful VIX Central (follow Eli on Twitter).

Example of VIX in Contango (6/23/15)


Example of VIX in Backwardation (9/1/15)


Using UVXY
All that said, there is absolutely a case for going long VIX futures / VIX ETNs. As the last few weeks have shown, there are very few financial instruments that have a correlation near -1.0 to stocks during periods of market distress.

One way to make an allocation is to simply allocate to a long VIX futures position only when they have a tailwind vs. headwind. Simply calculate the term premium (a simple way is to use the VIX/VXV ratio - details of what that is by the great Bill Luby here) to determine contango or backwardation (in this case when the VIX/VXV is less than or greater than 100) and only allocate to UVXY when it's above 100. To put some numbers behind that statement, the average modeled daily performance of UVXY is -1.1% when the ratio is < 100 (2500 trading days) and 5.0% when the ratio > 100 (378 trading days) since 2004.

As an example of putting this to work within a portfolio, below is an allocation to the S&P 500 compared against an allocation to the S&P 500 when the term structure is in contango (bad for UVXY), or a 83% allocation to the S&P 500 / 17% allocation to UVXY (UVXY is ~5-6x more volatile than the S&P 500 over the long-term) when the term structure is in backwardation (i.e. favorable to UVXY).


The above breaks down to annualized returns of 6.9% for the S&P 500 and 12.4% for the hedged version, while standard deviation moves from 19.6% for the S&P 500 down to 15.5% for the hedged version. In addition, max drawdowns moves from 55% down to 29%.

So, while I certainly feel the average retail investor should not be allowed access to something as volatile as UVXY without proof they have a good understanding of the mechanics that drive performance, I do think there is a benefit in using such vehicles for those that understand how they might tame them.